If you’ve been going through Motion Tricks, you’ve probably noticed that I use a SVG skill level meter on the top of each post. I use it to show the difficulty level of the article, but you can use it for many purposes.
This is an easy effect to achieve. All you really need is a few paths and the DrawSVG plugin from GreenSock. Let’s take a look.
Start in Adobe Illustrator
Jumping into Adobe Illustrator, I made a 600 x 600 artboard and added an ellipse with a radius of 150px. You should center it on the artboard (300,300) as it makes everything much easier.
We only need a half circle for this project. So, we want the start angle to be 0° and the end angle to be 180°. You can grab the little pie widget handle and manually rotate them to those angles. (figure 1)
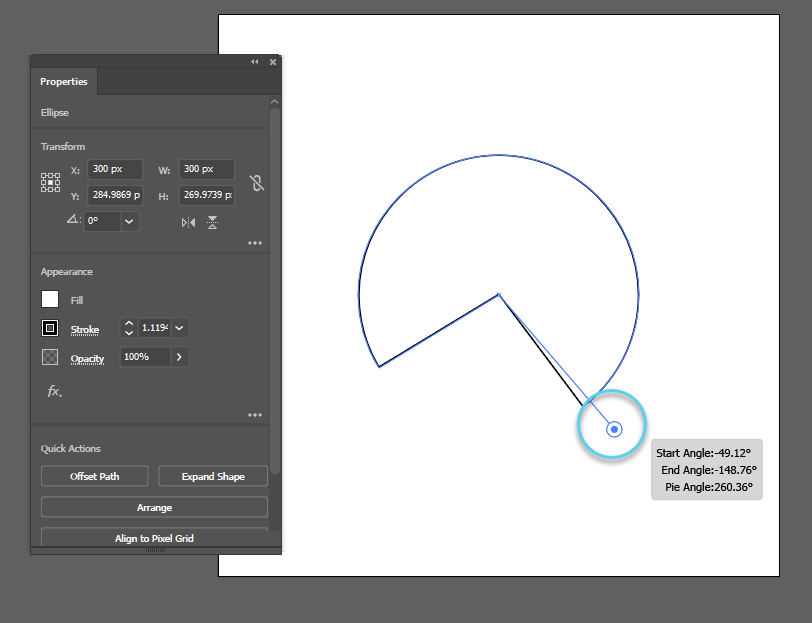
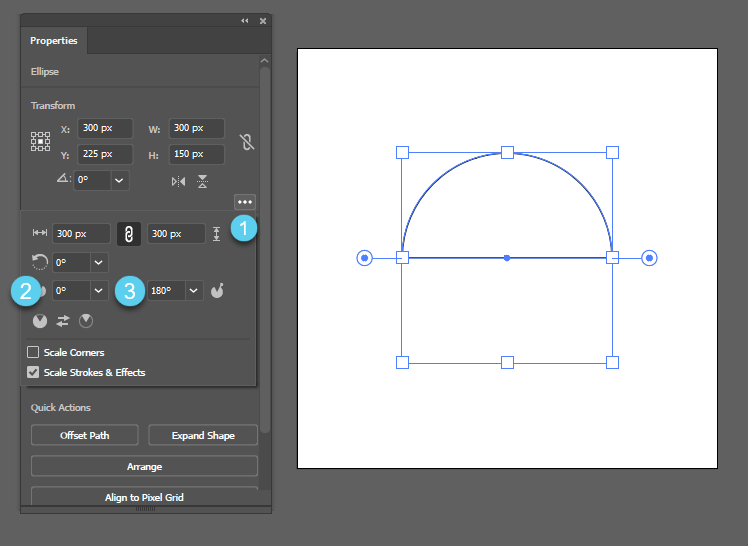
Rather than manually rotating those handles, I find it much easier to simply enter the angles for the ellipse. Under the properties panel for the ellipse, you’ll find the little pull-down for additional options. (#1 in figure 2). In there, you’ll see the start (#2) and end (#3) angles for the shape we need. Enter 0° for the start and 180° for the end to see the result in figure 2.
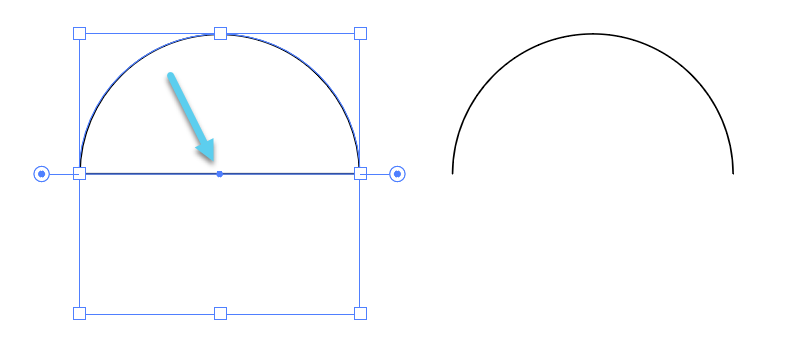
We only need the arch so use the Direct Selection Tool and delete the center point along the bottom segment. That should leave you with a nice little curve. (Figure 3)
Now, we need a little needle for the meter’s indicator. Before creating that element, I like to add a stroke to the open path we just made above. I used 50px for mine, but you can use whatever you like. The color is irrelevant as you can change it later.
The reason I add the stroke first is so I can determine how far I want the needle to protrude into the dial. Maybe you want it right in the middle or perhaps, you want it to go all the way through the dial as I do on the Motion Tricks skill meter.
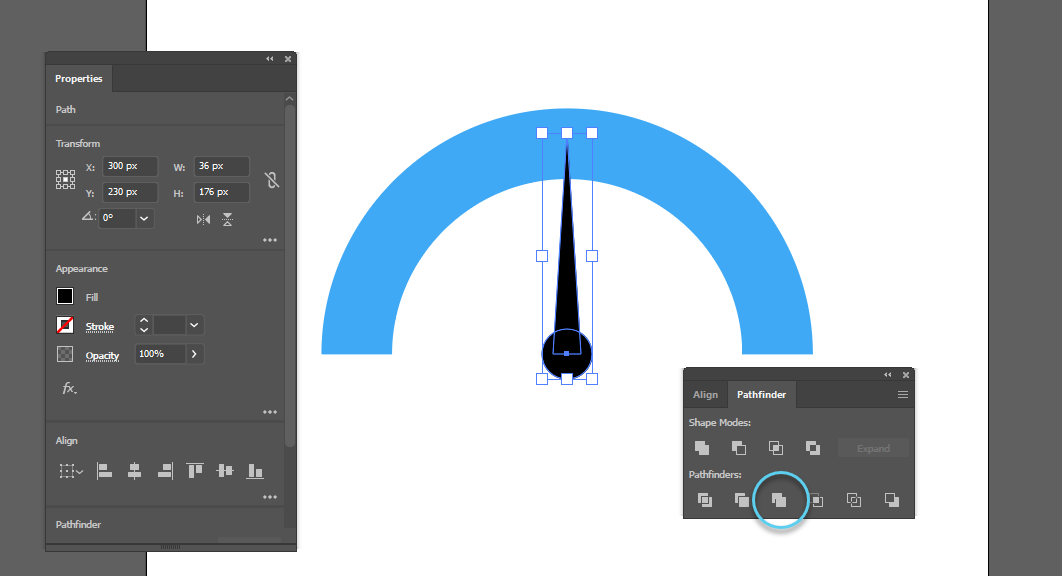
The needle is really simple. I used a 36px circle centered at (300,300) and a three-sided polygon. (Hey, that sounds like a triangle.) Scale the polygon to your liking. Mine ended up at a width of 20px and a height of 158px. Set the reference point of the polygon to center bottom and place it at (300,300). See how having everything centered makes it better?
After you make those two simple elements and have them at the right location, open your pathfinder tool and merge them. (figure 4)
Next, you need to rotate the needle 90° counterclockwise. You do that by selecting your path and using the rotate tool. Make sure you’re rotating around (300, 300).
Finally, I added a 450 x 250 rectangle at (x:300, y:225). Those coordinates are assuming a center, center reference point. The last thing is to trim the document to 450 x 250. Do that by selecting all three elements and (from the top menu) choose Object → Artboards → Fit To Selected Art. You end up with a document like figure 5.
Now you can export the code and we’re ready to animate. For more information about using a background rectangle, check out my post about exports and rectangles.
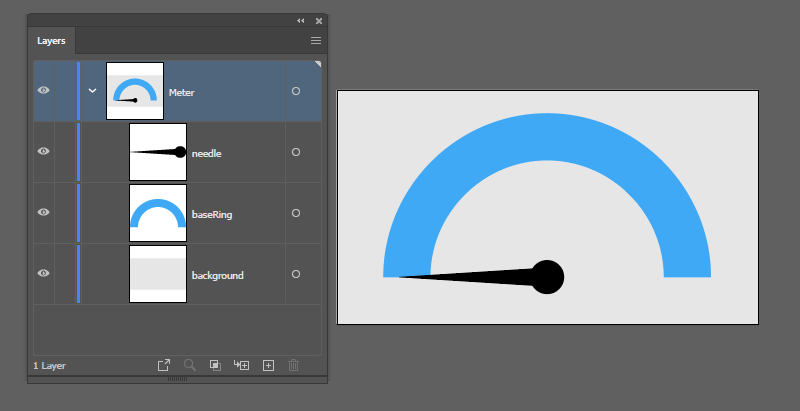
If everything was positioned correctly, you should have a SVG that looks like this:
<svg id="Meter" xmlns="http://www.w3.org/2000/svg" width="450" height="250" viewBox="0 0 450 250">
  <rect id="background" width="450" height="250" fill="#e6e6e6"/>
  <path id="baseRing" d="M75,200c0-82.29,67.71-150,150-150s150,67.71,150,150" fill="none" stroke="#3fa9f5" stroke-miterlimit="10" stroke-width="50"/>
  <path id="needle" d="M209.44,191,67,200l142.44,9a18,18,0,1,0,0-18Z"/>
</svg>
We need more paths
We’re gonna need a couple of copies of the baseRing path to make this all work. The first one we need is for the mask, which will reveal the path as we animate the needle. You can do a quick copy/paste and add some <defs></defs> to your SVG like this:
  <defs>
    <mask id="meterMask" maskUnits="userSpaceOnUse">
      <path id="maskRing" d="M75,200c0-82.29,67.71-150,150-150s150,67.71,150,150" fill="none" stroke="#fff" stroke-miterlimit="10" stroke-width="56" />
    </mask>
  </defs>
You’ll notice the mask has an ID and the duplicate path has one too. I just used “#maskRing”. I also changed the stroke width to 56 (for safety) and the stroke-color to white. Make sure to pay attention to the maskUnits attribute of “userSpaceOnUse”.
Now we’ll add another copy that makes up the background ring of our meter.
  <path id="baseRingDark" d="M75,200c0-82.29,67.71-150,150-150s150,67.71,150,150" fill="none" stroke="#444" stroke-miterlimit="10" stroke-width="54" />
  <path id="baseRing" d="M75,200c0-82.29,67.71-150,150-150s150,67.71,150,150" fill="none" stroke="#888" stroke-miterlimit="10" stroke-width="50" />
I changed the stroke color of the original baseRing to gray and duplicated it. The duplicate (baseRingDark) is a bit thicker and I used a slightly darker gray. This makes a little channel for the colored ring to animate through.
You don’t have to use an ID on these additional copies. I’m doing it for the sake of clarity. The only one that needs an ID is the one in the mask element.
Finally, we need one more copy and that will be placed into a group. The group will be masked. This will be the ring with color to be revealed.
  <g mask="url(#meterMask)">
    <path id="colorRing" d="M75,200c0-82.29,67.71-150,150-150s150,67.71,150,150" fill="none" stroke="#5cceee" stroke-miterlimit="10" stroke-width="50" />
  </g>
The GSAP code
Now the fun part. Let’s make this thing move. Using GSAP and the DrawSVG plugin, we need a simple timeline like this:
gsap.timeline({
    defaults: { duration: 4, ease: "none" },
    yoyo: true,
    repeat: -1,
    repeatDelay: 1
  })
  .from("#maskRing", { drawSVG: 0 })
  .to("#needle", { rotation: 180, svgOrigin: "225 200" }, 0);
I’ve used some defaults on the timeline and added two tweens. The first will animate the mask ring from a length of 0. The second rotates the needle. Using the position parameter of 0 makes them both start at the same time.
The SVG origin of “225 200” comes from our original file in Adobe Illustrator. Remember that we were working from a center point of 300,300, right? But then, we added that rectangle and trimmed the document.
The width of the document went from 600 to 450 so we know the x coordinate is 50% of that. That’s how we got 225. Trimming the document to the size of that rectangle took 100px off the top of the document, which took the y pivot point of the needle from 300 down to 200.
Once we add the timeline, we get this for an end result.
See the Pen Simple Meter by Craig Roblewsky (@PointC) on CodePen.
Final thoughts
You can link your SVG skill level meter to a counter or add knobs and sliders to control it. All kinds of fun but we’ll save that for another tutorial. Until next time, keep your pixels movin’.


