You’re probably used to creating your SVG masterpieces in your vector software. Maybe Adobe Illustrator or Inkscape. Maybe you hand code some elements too. But what if you want a whole bunch of repeating shapes? That can be a bit cumbersome.
In those cases, it is often faster, easier and more flexible to let JavaScript do the heavy lifting for you. In this tutorial, we’ll take a look at creating dynamic SVG elements.
Starter info
All of the following demos have an empty SVG element in the HTML. I’ve manually added it, but you can create and add it via JavaScript as well. I also used a background rectangle so we can see what we’re doing.
<svg xmlns="http://www.w3.org/2000/svg" width="400" height="400" viewBox="0 0 400 400">
<rect width="100%" height="100%" fill="#000" />
</svg>
SVG Namespace
To create SVG elements, we need to use the createElementNS() method. The syntax from the MDN docs reads:
var element = document.createElementNS(namespaceURI, qualifiedName[, options]);
Cool, but what does that mean? The namespace is simply “http://www.w3.org/2000/svg”. That just says, “Hey, we’re creating SVG elements here.” The qualified name is the element we’re creating — rect, text, circle etc. We won’t worry about the optional options parameter. Creating a rectangle looks like this:
// make a simple rectangle
let newRect = document.createElementNS("http://www.w3.org/2000/svg", "rect");
The code above won’t show anything as we haven’t styled the rectangle or added it to the SVG document yet. We also don’t want to keep typing out the SVG namespace so we assign that to a variable. The new code looks like this:
// variable for the namespace
const svgns = "http://www.w3.org/2000/svg";

// make a simple rectangle
let newRect = document.createElementNS(svgns, "rect");
Again, nothing showing yet as it has no style and has not been appended to the SVG. Let’s do that next.
Styling and appending
To style the rectangle, you can use the setAttribute() method.
newRect.setAttribute("x", "150");
newRect.setAttribute("y", "150");
newRect.setAttribute("width", "100");
newRect.setAttribute("height", "100");
newRect.setAttribute("fill", "#5cceee");
Appending
To append the rectangle to the SVG, you target the SVG and use the appendChild() method.
// targeting the svg itself
const svg = document.querySelector("svg");

// append the new rectangle to the svg
svg.appendChild(newRect);
See the Pen Dynamic SVG Element Creation #1 by Craig Roblewsky (@PointC) on CodePen.
Pretty easy, but not too exciting yet, is it? Well, we have to learn to walk before we can run.
Easier styling with GSAP
You can use the setAttribute() method I showed above (if you like), but I animate everything with GSAP so I’ll be taking advantage of those tools and using the set() method to style my elements. This is what I’ll be using for the rest of this article and all the demos.
Using the core GreenSock tools (GSAP) and the attrPlugin (short for attribute plugin), we can accomplish the same thing from above in a more concise syntax.
// set attributes of new rectangle
gsap.set(newRect, {
  attr: { x: 150, y: 150, width: 100, height: 100, fill: "#5cceee" }
});
See the Pen Dynamic SVG Element Creation #2 by Craig Roblewsky (@PointC) on CodePen.
A little easier, right? Note: the attrPlugin is built into the core file so you don’t need to load it separately.
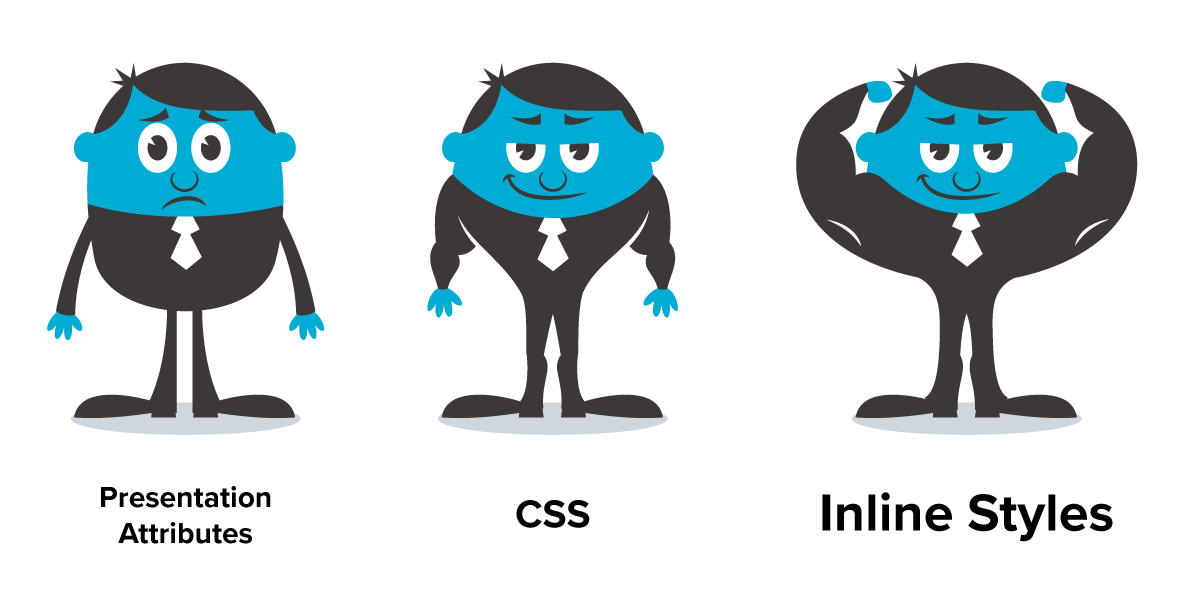
Presentation attributes, CSS and inline styles — oh my!
Before we go any further, we need to talk about styling these dynamic SVG elements. In the demos above, we added presentation attributes to the rectangle. You would think those attributes would be at the top of the chain for styling since we added them directly to the element, but no. They can be wiped out with some simple CSS.
Using GSAP to set the styles, we have the option of attributes or inline styles. Anything inside the attr:{} wrapper will be presentation attributes. If I move a property outside that wrapper and set() it, we get an inline style.
// note the fill is now being set outside of the attr:{}
gsap.set(newRect2, {
  attr: { x: 250, y: 150, width: 100, height: 100, class: "target" },
  fill: "#5cceee"
});
The difference may not be obvious because the end result looks the same, but as I mentioned, presentation attributes can be overwritten with CSS.
Let’s look at an example with two rectangles set to a light blue fill. One has a presentation attribute while the other has an inline style. I’ll also add a class of ‘target’.
<svg xmlns="http://www.w3.org/2000/svg" width="400" height="400" viewBox="0 0 400 400">
<rect width="100%" height="100%" fill="#000"></rect>
<rect class="target" fill="#5cceee" height="100" width="100" y="150" x="50"></rect>
<rect class="target" height="100" width="100" y="150" x="250" style="fill: rgb(92, 206, 238);"></rect></svg>
See how one has a fill attribute while the other has an inline style? Now let’s add some simple CSS to change the fill color of the .target class.
.target {
  fill: yellow;
}
See the Pen Dynamic SVG Element Creation #2a by Craig Roblewsky (@PointC) on CodePen.
See how the rectangle with the fill attribute was overwritten by the CSS? The one with the inline style is not changed. The only way to have the CSS overwrite the inline style rectangle is using ‘!important’.
So, which should you use?
You’ll probably want to use CSS properties (stylesheet or inline style) as much as possible. Why?
According to w3.org:
“In the future, any new properties that apply to SVG content will not gain presentation attributes. Therefore, authors are suggested to use styling properties, either through inline properties or style sheets, rather than presentation attributes, for styling SVG content.“
This applies to presentation attributes, not positioning. In many modern browsers, you can use CSS for attributes like cx, cy, r etc. When SVG2 is released, it will have geometry properties (cx, cy, r, rx, ry etc.). I’m not going to dive too deep into upcoming features. You can read more about that at your leisure.
Until SVG2 is ready, I’d recommend erring on the side of caution and put all position attributes into the attribute wrapper when setting them. You can always try things with CSS and if it doesn’t work in some browsers, go ahead and make it an attribute.
Throughout the rest of this article, I’ll be using some CSS, some presentation attributes and some inline styles (just for variety). I won’t go into detail about each instance, but you can check the code of each demo to see how it was created.
More rectangles please, let’s loop
Let’s get back to it with dynamic element creation. This time there is a SVG in the HTML, but it has no viewBox, width or height attributes. We’ll set the size of the SVG dynamically, depending on how many rectangles we create in the loop.
We’ll add a variable for how many rectangles, width and height. This will be a single row of rectangles so the overall width and height of the SVG is easy to calculate: width * number of rectangles.
// change any value
let width = 80;
let height = 60;
let targets = 6;
const colorArray = ["#94c356", "#46a4cc", "#a63e4b"];

// figure the new svg width/height
const svgWidth = width * targets;
const svgHeight = height;

gsap.set(svg, {
  attr: {
    width: svgWidth,
    height: svgHeight,
    viewBox: "0 0 " + svgWidth + " " + svgHeight
  }
});
Note: we want to use the attr:{} wrapper for the SVG width, height and viewBox. If you applied the width & height as an inline style, the SVG would no longer be responsive. In this case, I’ve set the width to 90vw in the CSS. After that, it’s the same rectangle creation code from above except it’s now in a loop.
for (let i = 0; i < targets; i++) {
  let newRect = document.createElementNS(svgns, "rect");
  gsap.set(newRect, {
      x: i * width,
      y: 0,
      width: width,
      height: height,
      fill: colorArray[i % colorArray.length]
  });
  svg.appendChild(newRect);
}
I’m not using the attr:{} wrapper here so we’re getting a transform for ‘x’ instead of an ‘x’ attribute. (The visual appearance is the same.) The x position is set by multiplying the loop counter by the width variable. The fill color is also pulling from the colorArray using the modulus operator.
See the Pen Dynamic SVG Element Creation #3 by Craig Roblewsky (@PointC) on CodePen.
You can see the SVG attributes were added correctly and the size was set for us.
<svg xmlns="http://www.w3.org/2000/svg" viewBox="0 0 480 60" height="60" width="480"></svg>
Rows and columns
Okay, what if we want something like a grid? No problem. A few minor changes and we’ll be good to go. Instead of a simple number of targets, we’ll use rows and columns variables. We’ll change the math a bit to correctly size the SVG. I’m using a counter variable for the color array. This will also be used for adding numbers in the next section.
let columns = 4;
let rows = 5;
let counter = 0;

// figure the new svg width/height
const svgWidth = width * columns;
const svgHeight = height * rows;
Loop around your loop
Our old loop from the last section will become the columns. We then add another loop around that loop for the rows.
for (let j = 0; j < rows; j++) {
  for (let i = 0; i < columns; i++) {
    counter++;
    let newRect = document.createElementNS(svgns, "rect");
    gsap.set(newRect, {
      attr: {
        x: i * width,
        y: j * height,
        width: width,
        height: height,
        fill: colorArray[counter % colorArray.length]
      }
    });
    svg.appendChild(newRect);
  }
}
This time I used the attr:{} wrapper so all our properties are placed onto the element as attributes. Please open the inspector to see the differences from the last section.
See the Pen Dynamic SVG Element Creation #4 by Craig Roblewsky (@PointC) on CodePen.
Let’s add some numbers
A quick addition will place a number in the middle of each square. Using the counter variable and creating a text element is all we need. Then drop that into the inner loop.
    let txt = document.createElementNS(svgns, "text");
    txt.textContent = counter;
    svg.appendChild(txt);
    gsap.set(txt, {
        x: i * width + width / 2,
        y: j * height + height / 2
    });
Notice I’m not using the attribute this time so the x/y are transforms rather than presentation attributes. I also added a little bit of CSS to style and center the text elements.
text {
  font-size: 24px;
  fill: white;
  text-anchor: middle;
  dominant-baseline: middle;
}
See the Pen Dynamic SVG Element Creation #5 by Craig Roblewsky (@PointC) on CodePen.
How about some padding?
SVGs don’t have padding, but we can easily fake some. Adding a fakePadding variable and a couple of changes in the position calculation is all we need to make a nice grid.
const fakePadding = 10; // this will be the overall padding and the space between rectangles

// figure the new svg width/height
const svgWidth = width * columns + (columns + 1) * fakePadding;
const svgHeight = height * rows + (rows + 1) * fakePadding;
We also need a slight modification for the x/y position of each rectangle to account for our new fakePadding.
    let newX = (width + fakePadding) * i + fakePadding;
    let newY = (height + fakePadding) * j + fakePadding;
    gsap.set(newRect, {
        x: newX,
        y: newY,
        width: width,
        height: height,
        fill: colorArray[counter % colorArray.length]
    });
See the Pen Dynamic SVG Element Creation #6 by Craig Roblewsky (@PointC) on CodePen.
Make those squares move
This tutorial isn’t really about motion. What? But it’s motiontricks.com, right? Let’s not forget the overall goal with all this dynamic element creation is to put them into motion. Here’s the above demo with a quick timeline. FYI – I’m using the x/y attributes so we can animate all the targets from the upper left corner.
gsap
  .timeline({ delay: 1 })
  .from("#targets rect", {
    duration: 0.75,
    attr: { x: 0, y: 0 },
    opacity: 0,
    stagger: {
      amount: 0.75,
      from: "random"
    },
    ease: "sine.inOut"
  })
  .from("text", {
    duration: 0.35,
    opacity: 0,
    ease: "none"
  });
See the Pen Dynamic SVG Element Creation #7 by Craig Roblewsky (@PointC) on CodePen.
Rolling over to circles
See what I did there? Rolling? Circles? Groan… Okay, let’s get to it. Those rectangle were getting a bit square. Let’s work with some circles and a new colorArray. We’ll forget the padding on this one, but we’ll add a space between each circle.
You could create all the circles at 0,0 and transform them to the correct x/y positions, but let’s see how to make it work with cx/cy. First, a little change in the overall SVG size calculation is necessary. We now have a radius instead of width/height and a spacing variable.
// change any of these values
const circles = 7;
const radius = 50;
const spacing = 20; // this will be the space between circles
const colorArray = ["#829FD9", "#BABF2A", "#735702", "#027368"];
let counter = 0;

// figure the new svg width/height
const svgWidth = radius * 2 * circles + (circles - 1) * spacing;
const svgHeight = radius * 2;
The circles position
Putting the circles in the correct position is similar to the rectangles except we’re figuring the middle instead of the upper left corner. The cy position is simply the radius as this is just one row of circles.
  let newCirc = document.createElementNS(svgns, "circle");
  let newX = (radius * 2 + spacing) * i + radius;
  gsap.set(newCirc, {
    attr: {
      cy: radius,
      cx: newX,
      r: radius,
      fill: colorArray[counter % colorArray.length]
    },
   });
See the Pen Dynamic SVG Element Creation #8 by Craig Roblewsky (@PointC) on CodePen.
Adding a clip-path
For a little bit of fun, let’s make an animation for each circle. We’ll reveal the circles from bottom to top with a click. To do that, we’ll use a clipPath. Up until now, we’ve added the dynamic elements to the root SVG. This time, I’m adding some empty groups.
<svg xmlns="http://www.w3.org/2000/svg">
  <defs>
    <clipPath id="theClipPath"></clipPath>
  </defs>
  <g id="baseGroup" clip-path="url(#theClipPath)"></g>
  <g id="strokeGroup"></g>
  <g id="numbersGroup"></g>
</svg>
We append the base circles to the baseGroup, which is clipped by the clipPath group. I’ll also add a second transparent circle that will not be clipped and has a stroke. These will be our click targets. Finally, we’ll add a rectangle for each base circle and add it to the clipPath.
The base circles with color are created the same way as the last demo so I won’t cover that again. The only change is they get appended to a group, instead of the root SVG.
The stroked circle (our click target)
We need an empty target to click so we create a second circle in our loop. This one has the same center as the base-color circle, but the radius is a bit smaller. Why? I’m adding a 4 unit stroke so I subtract the 2 units from the radius since strokes are center aligned.
  // make the stroked circle
  let newStroke = document.createElementNS(svgns, "circle");
  gsap.set(newStroke, {
    attr: {
      cy: radius,
      cx: newX,
      r: radius - 2
    }
  });
  strokeGroup.appendChild(newStroke);
  newStroke.index = i;
  newStroke.addEventListener("click", animateClip);
Some of the style for the stroked circle is in the CSS.
#strokeGroup circle {
  cursor: pointer;
  stroke: white;
  stroke-width: 4;
  fill: transparent;
}
I’ve given each one an index and a click listener for the animate function (coming up). I also appended each stroked version to its own group.
clip-path rectangles
Next, we need a rectangle to cover each base-colored circle so we can reveal it on click. This is all pretty much the same as the earlier rectangle demos except we’re appending them to the clipPath group so they won’t render. We also need a little math to get them into the correct position since we have a radius instead of width/height this time.
  // make the rectangles for the clip-paths
  let newRect = document.createElementNS(svgns, "rect");
  clipPathGroup.appendChild(newRect);

  gsap.set(newRect, {
    attr: {
      x: newX - radius,
      y: 0,
      width: radius * 2,
      height: radius * 2,
    }
  });
Make the animation
I created an empty array for the animations and we’ll play the correct one based on the index of the clicked stroked circle’s index number. Each clipped rectangle is tweened from yPercent:100 so it will be placed below the circle it is clipping. The tween is reversed, which sets the playhead to reverse. Since it’s at the beginning of the tween, nothing happens until we click. That tween is then pushed into our array of animations.
const anims = [];

 let tween = gsap
    .from(newRect, { yPercent: 100, ease: "sine.inOut" })
    .reversed(true);
  anims.push(tween);
Call the animations
The animateClip() function simply reverses the playhead of the timeline. Whatever state it’s in, it flips.
function animateClip() {
  anims[this.index].reversed(!anims[this.index].reversed());
}
The interactive result
Give it a try. Each click of a stroked circle will reveal/hide the base-colored circle. Pretty cool.
See the Pen Dynamic SVG Element Creation #9 by Craig Roblewsky (@PointC) on CodePen.
If you need a refresher, I wrote a tutorial about masks and clip-paths.
Lines too
If you’ve seen my wavy gauge tutorial and demo, you probably noticed the tick marks were dynamically created. I used the same techniques for the circles and rectangles above except we now have four attributes for each line (x1,x2,y1,y2).
I’ve used an inner and outer loop. The inner loop creates five vertical lines by calling the makeLine() function.
// creates the line elements
function makeLine(yp) {
  let newLine = document.createElementNS(svgns, "line");
  svg.appendChild(newLine);
  gsap.set(newLine, {
    attr: { x1: startX, x2: startX, y1: yp, y2: y2Pos }
  });
}
The outer loop creates the number above the taller tick mark via the makeNumber() function and starts the inner loop.
// creates the numbers
function makeNumber() {
  let txt = document.createElementNS(svgns, "text");
  svg.appendChild(txt);
  txt.textContent = count;
  gsap.set(txt, {
    attr: { x: startX, y: y2Pos - 40 }
  });
}
The other difference is the SVG width/height and viewBox were already set so I made the gauge fit within the bounds. I won’t dive into the rest of this one, but go ahead and check out the demo. It’s the wavy numbers gauge demo without the animation. You’re just left with the tick marks ruler.
See the Pen Dynamic SVG Element Creation #10 by Craig Roblewsky (@PointC) on CodePen.
Final thoughts
The benefit (of all the above techniques) is you can adjust things on the fly without going back to your vector software. I encourage you to check out any of the demos and adjust some of the variables to see how flexible they can be.
It’s not just for circles, rectangles, text and lines. You can create most any shape element. Give it a try with polygons, polylines and even ellipses. You can dynamically create curves and paths too, but that’s a bit more involved so I’ll save it for another tutorial.
I hope you picked up a few pixels of information about creating dynamic SVG elements. Until next time, keep your pixels movin’.


